Notable Trends
- This April, the national rent index continued its trend of stable annual rates with one-bedrooms down 0.6% to $1,486, while two-bedrooms increased 0.1% to $1,843.
- All six of the North Carolina cities in our report saw one-bedroom rent decline annually with Winston Salem experiencing the second largest downturn in the country.
- New York City continues to buck national trends, with rent up 20% since this time last year and up 50% since pre-pandemic days, and currently has the tightest rental vacancy rate it’s seen in decades.

Modest changes to the national rent rates expected for the rest of the year due to imbalanced relationship between supply and demand
The national rent index continued its trend of stable annual rates with one-bedrooms down 0.6% to $1,486, while two-bedrooms increased 0.1% to $1,843. As normal seasonality patterns return and the rental market has leveled off from the price spikes seen in the last few years, the national one-bedroom rate is now about $9 cheaper than it was last year. However, even with this cooling, the national one-bedroom rent is still nearly $250 pricier than it was in 2021.

Changes to the national rent rates for the rest of the year, and likely into 2025 as well, should remain fairly modest due to the current imbalanced relationship between supply and demand. Although the demand for rentals in the U.S. is significant, as wage growth has outpaced rent growth for the past 15 months and the population in their prime renting years is large, it is still trailing behind the amount of supply that is becoming available this year. Even with peak demand in the summer and fall months, the new apartment inventory across the nation, as it will reach a 50-year high over the summer, will keep the overall national rates fairly restrained.
“It seems we are firmly settled into the year of the renter as people have more options now than in recent memory,” says Zumper CEO Anthemos Georgiades. “With Class A buildings marketing concessions that include up to three months of free rent, free parking, and waived deposits and application fees, this, in turn, puts pressure on Class B and C buildings to price competitively as well in order to attract tenants.”
You can find more information on property classifications here.
Rent prices in all six North Carolina cities are down annually
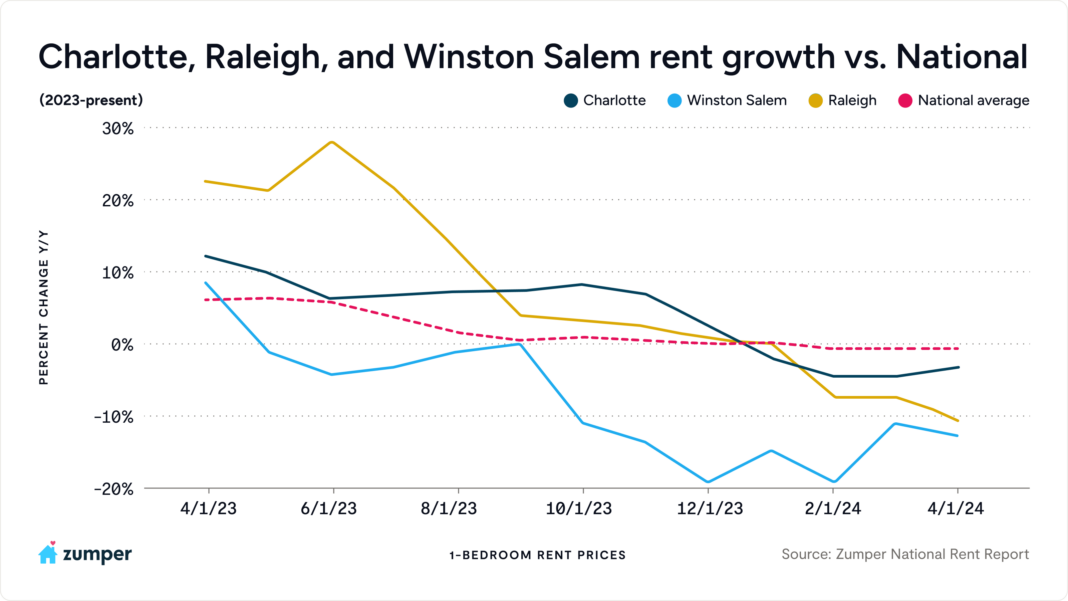
A more localized rental market that exemplifies this current interaction of oversupply meeting a considerable albeit still dragging demand is North Carolina. All six of the North Carolina cities in our report saw one-bedroom rent down annually with Winston Salem experiencing the second largest decline in the country, just behind Gilbert, AZ. Of our North Carolina cities, Winston Salem led the pack with rent down 12.6% and was followed by Raleigh and Greensboro, which had rents down between 5%-11%. Apartment inventory across the Raleigh and Durham areas are expected to increase over 50% this year and Charlotte’s supply growth has continued to surpass national averages as well. Charlotte’s occupancy rate even dropped to 93.7% toward the end of 2023, a decade low and down significantly from the record high of 97.2% seen in the beginning of 2022.
However, as we look ahead, North Carolina markets should make a strong recovery as Charlotte and Raleigh had some of the highest recent apartment demand in the country and has maintained pace as one of the fastest growing populations across the nation.
NYC continues to buck national trends with rent up 50% since pre-pandemic days
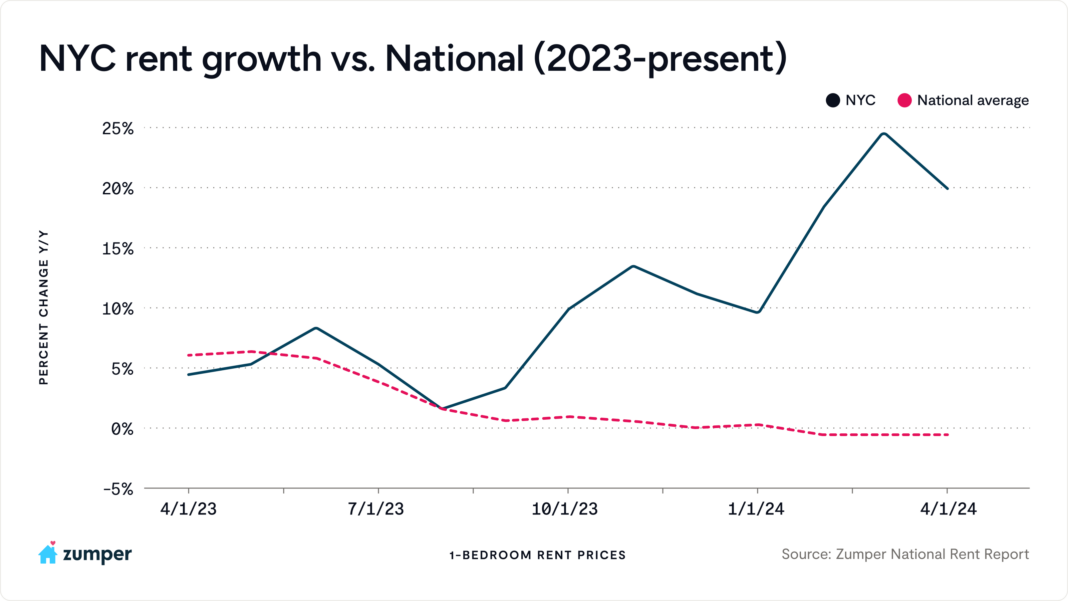
A rental market that routinely bucks national trends is New York City. One-bedroom rent here is currently the most expensive in the nation, sitting at $4,280, and is up 19.9% annually. Two-bedroom units are priced at $4,950 and are up 26% annually. Compared to its pre-pandemic price in March 2020, New York City one-bedroom rent has spiked 50%. The high annual rates and prices reflect that this city is bearing the tightest rental vacancy rate it’s seen since the 1960’s, currently at a mere 1.4%. The national rental vacancy rate is 6.6%. However, there may be some good news for renters in the Big Apple as there are almost 25k units scheduled to be completed in 2024, which would mark the highest delivery volume in over 15 years.

If you’re interested in how Zumper’s historical rent data compares with the Shelter CPI produced monthly by the U.S. Bureau of Labor Statistics, view our updated chart here: https://www.zumper.com/blog/zumper-consumer-price-index/.
Full Data
| 1 bedroom | 2 Bedrooms | |||||||
|---|---|---|---|---|---|---|---|---|
| Ranking | Ranking Change | City | Price | M/M% | Y/Y% | Price | M/M% | Y/Y% |
| 1 | 0 | New York, NY | $4,280 | 1.90% | 19.90% | $4,950 | 6.00% | 26.00% |
| 2 | 0 | Jersey City, NJ | $3,250 | -0.30% | 8.30% | $3,590 | -6.00% | 1.70% |
| 3 | 0 | San Francisco, CA | $2,910 | 0.30% | -3.00% | $3,840 | -0.30% | -4.00% |
| 4 | 0 | Boston, MA | $2,860 | 0.40% | 5.90% | $3,480 | 0.90% | 5.50% |
| 5 | 0 | Miami, FL | $2,740 | 1.10% | -3.50% | $3,630 | 0.00% | -2.20% |
| 6 | 0 | San Jose, CA | $2,550 | 4.10% | -1.90% | $3,240 | 0.30% | 0.30% |
| 7 | 1 | San Diego, CA | $2,360 | 1.30% | -1.70% | $3,200 | 2.20% | 0.60% |
| 8 | -1 | Arlington, VA | $2,340 | 0.00% | 3.10% | $3,000 | 1.40% | -0.70% |
| 9 | 0 | Los Angeles, CA | $2,300 | 0.00% | -4.20% | $3,250 | -1.50% | -1.50% |
| 10 | 0 | Washington, DC | $2,280 | 0.40% | -1.70% | $3,130 | 3.60% | -1.30% |
| 11 | 0 | Santa Ana, CA | $2,150 | 0.50% | 1.90% | $2,830 | -1.00% | -1.00% |
| 12 | 0 | Chicago, IL | $2,140 | 1.90% | 18.90% | $2,700 | 1.50% | 24.40% |
| 13 | 0 | Anaheim, CA | $2,010 | 0.50% | 0.50% | $2,580 | -0.80% | -0.40% |
| 14 | 4 | Urban Honolulu, HI | $2,000 | 5.30% | 5.30% | $2,830 | 5.60% | 9.70% |
| 14 | 2 | Fort Lauderdale, FL | $2,000 | 2.60% | -4.80% | $2,900 | -1.70% | 3.60% |
| 14 | -1 | Oakland, CA | $2,000 | 0.00% | -9.10% | $2,650 | 1.10% | -5.40% |
| 17 | -2 | Charleston, SC | $1,890 | -3.60% | 3.80% | $2,400 | -2.00% | -1.60% |
| 17 | 0 | Seattle, WA | $1,890 | -1.00% | -4.50% | $2,500 | -3.50% | -8.40% |
| 19 | 0 | Denver, CO | $1,820 | 0.60% | 6.40% | $2,400 | 0.80% | 2.10% |
| 20 | 0 | Long Beach, CA | $1,800 | 0.00% | 0.00% | $2,340 | -1.30% | -2.50% |
| 21 | 0 | New Haven, CT | $1,750 | 0.60% | 10.80% | $2,100 | 0.00% | 8.80% |
| 22 | 2 | Atlanta, GA | $1,700 | 3.00% | -2.90% | $2,160 | 0.90% | -4.80% |
| 23 | 2 | Providence, RI | $1,660 | 3.80% | -2.40% | $2,150 | 0.50% | 13.20% |
| 23 | -1 | Scottsdale, AZ | $1,660 | -2.40% | -8.80% | $2,240 | 2.30% | -10.40% |
| 25 | 0 | Tampa, FL | $1,650 | 3.10% | -1.20% | $1,900 | 0.50% | -4.00% |
| 26 | -3 | Nashville, TN | $1,640 | -2.40% | -5.20% | $1,950 | 3.20% | 7.10% |
| 27 | 0 | Virginia Beach, VA | $1,600 | 1.90% | 6.70% | $1,760 | 1.70% | 7.30% |
| 28 | -1 | Orlando, FL | $1,580 | 0.60% | -4.20% | $1,860 | 1.60% | -4.10% |
| 29 | 0 | New Orleans, LA | $1,550 | -0.60% | -0.60% | $1,800 | 0.00% | 0.00% |
| 30 | 2 | Henderson, NV | $1,540 | 2.70% | 4.10% | $1,790 | 1.70% | 5.30% |
| 30 | -1 | St. Petersburg, FL | $1,540 | -1.30% | -3.10% | $2,120 | -3.60% | 1.00% |
| 32 | 0 | Charlotte, NC | $1,520 | 1.30% | -3.20% | $1,840 | 1.70% | 1.70% |
| 33 | -2 | Austin, TX | $1,510 | -1.30% | -5.00% | $1,940 | -1.00% | -0.50% |
| 34 | 3 | Madison, WI | $1,500 | 2.00% | 13.60% | $1,810 | -0.50% | 13.80% |
| 34 | 1 | Philadelphia, PA | $1,500 | 1.40% | 1.40% | $1,770 | 1.10% | -1.70% |
| 36 | -4 | Sacramento, CA | $1,490 | -0.70% | -5.70% | $1,850 | -0.50% | -1.60% |
| 37 | -2 | Plano, TX | $1,480 | 0.00% | 4.20% | $2,030 | 0.50% | 8.00% |
| 38 | -1 | Newark, NJ | $1,470 | 0.00% | 4.30% | $2,030 | -1.00% | 14.00% |
| 39 | 2 | Asheville, NC | $1,460 | 3.50% | -1.40% | $1,730 | -3.40% | -3.90% |
| 40 | 0 | Portland, OR | $1,450 | 1.40% | -3.30% | $1,800 | 0.00% | 0.00% |
| 41 | 0 | Durham, NC | $1,430 | 1.40% | -4.70% | $1,770 | 6.00% | 0.60% |
| 42 | 8 | Norfolk, VA | $1,410 | 6.00% | 17.50% | $1,520 | 6.30% | 8.60% |
| 43 | 1 | Aurora, CO | $1,400 | 1.40% | 3.70% | $1,900 | 0.00% | 5.60% |
| 44 | -5 | Gilbert, AZ | $1,370 | -6.20% | -17.00% | $1,680 | -6.10% | -12.00% |
| 45 | 7 | Fresno, CA | $1,360 | 4.60% | 8.80% | $1,610 | 1.30% | 3.90% |
| 45 | 3 | Knoxville, TN | $1,360 | 1.50% | 7.10% | $1,690 | 3.00% | 12.70% |
| 45 | 1 | Dallas, TX | $1,360 | 0.00% | -9.30% | $1,970 | 1.00% | -7.50% |
| 48 | -5 | Baltimore, MD | $1,350 | -2.90% | -2.90% | $1,580 | -1.30% | -1.30% |
| 49 | -2 | Richmond, VA | $1,330 | -1.50% | 2.30% | $1,600 | 0.00% | 6.70% |
| 50 | -5 | Boise, ID | $1,320 | -3.60% | -9.00% | $1,500 | 0.00% | 0.00% |
| 51 | 8 | Mesa, AZ | $1,310 | 4.80% | -0.80% | $1,590 | 3.20% | 0.60% |
| 52 | 2 | Anchorage, AK | $1,300 | 0.80% | 5.70% | $1,600 | 0.00% | 11.90% |
| 52 | -2 | Salt Lake City, UT | $1,300 | -2.30% | 0.00% | $1,690 | -0.60% | 5.60% |
| 52 | 5 | Reno, NV | $1,300 | 1.60% | -1.50% | $1,690 | 3.00% | -0.60% |
| 52 | -4 | Minneapolis, MN | $1,300 | -3.00% | -3.70% | $1,840 | -2.10% | -4.70% |
| 52 | 5 | Phoenix, AZ | $1,300 | 1.60% | -7.10% | $1,550 | -0.60% | -8.80% |
| 57 | -3 | Irving, TX | $1,290 | 0.00% | -5.80% | $1,660 | -0.60% | -5.70% |
| 58 | -6 | Cleveland, OH | $1,280 | -1.50% | 12.30% | $1,330 | -1.50% | 11.80% |
| 59 | -5 | Raleigh, NC | $1,270 | -1.60% | -10.60% | $1,560 | 0.00% | -2.50% |
| 60 | 1 | Jacksonville, FL | $1,250 | 0.80% | -3.80% | $1,450 | 0.00% | 0.00% |
| 60 | 1 | Chattanooga, TN | $1,250 | 0.80% | -6.00% | $1,360 | -2.20% | -9.30% |
| 62 | 3 | Pittsburgh, PA | $1,240 | 3.30% | 3.30% | $1,600 | 3.20% | 6.70% |
| 63 | -2 | Las Vegas, NV | $1,230 | -0.80% | -4.70% | $1,510 | 0.00% | -2.60% |
| 63 | 5 | Glendale, AZ | $1,230 | 3.40% | -5.40% | $1,480 | 2.80% | -9.20% |
| 65 | -6 | Fort Worth, TX | $1,220 | -2.40% | -6.20% | $1,500 | -1.30% | -3.80% |
| 66 | -1 | Columbus, OH | $1,210 | 0.80% | 22.20% | $1,380 | 0.70% | 2.20% |
| 67 | -2 | Buffalo, NY | $1,170 | -2.50% | 15.80% | $1,290 | -0.80% | 3.20% |
| 68 | 1 | Colorado Springs, CO | $1,150 | 1.80% | -4.20% | $1,490 | 2.10% | -3.90% |
| 68 | -4 | Houston, TX | $1,150 | -5.00% | -8.00% | $1,440 | -5.30% | -7.10% |
| 70 | 2 | Arlington, TX | $1,110 | 0.00% | -0.90% | $1,480 | 0.00% | 4.20% |
| 70 | 4 | Indianapolis, IN | $1,110 | 4.70% | -5.10% | $1,300 | 0.80% | 4.00% |
| 72 | 5 | Syracuse, NY | $1,100 | 5.80% | 27.90% | $1,370 | 3.00% | 24.50% |
| 72 | -3 | Rochester, NY | $1,100 | -2.70% | 12.20% | $1,400 | -3.40% | 12.00% |
| 72 | 5 | Bakersfield, CA | $1,100 | 5.80% | 8.90% | $1,450 | 2.80% | 11.50% |
| 72 | -3 | Kansas, City, MO | $1,100 | -2.70% | 7.80% | $1,340 | 1.50% | 3.10% |
| 76 | -3 | Spokane, WA | $1,090 | 1.90% | 9.00% | $1,400 | 2.90% | 1.40% |
| 77 | 2 | Louisville, KY | $1,070 | 5.90% | -4.50% | $1,250 | 5.90% | 5.00% |
| 78 | -4 | San Antonio, TX | $1,060 | 0.00% | -5.40% | $1,340 | -0.70% | -1.50% |
| 79 | 1 | Cincinnati, OH | $1,040 | 4.00% | 6.10% | $1,450 | 4.30% | 4.30% |
| 80 | 3 | Omaha, NE | $1,030 | 4.00% | 5.10% | $1,420 | 2.90% | 4.40% |
| 81 | -5 | Milwaukee, WI | $1,010 | -3.80% | 5.20% | $1,200 | 4.30% | 8.10% |
| 82 | -2 | Detroit, MI | $1,000 | 0.00% | -2.00% | $1,100 | 0.00% | 0.00% |
| 83 | 3 | Des Moines, IA | $990 | 3.10% | 4.20% | $1,180 | 1.70% | 12.40% |
| 84 | -4 | Tallahassee, FL | $980 | -2.00% | -10.90% | $1,250 | -1.60% | 4.20% |
| 85 | 2 | Albuquerque, NM | $970 | 2.10% | -5.80% | $1,260 | -0.80% | -9.40% |
| 85 | 0 | Greensboro, NC | $970 | 0.00% | -7.60% | $1,150 | -0.90% | -4.20% |
| 87 | -4 | Baton Rouge, LA | $960 | -3.00% | 3.20% | $1,100 | -3.50% | 3.80% |
| 88 | 0 | Lexington, KY | $950 | 1.10% | 11.80% | $1,240 | 5.10% | 11.70% |
| 89 | 0 | St. Louis, MO | $940 | 2.20% | 4.40% | $1,300 | -0.80% | 4.80% |
| 89 | 1 | Tucson, AZ | $940 | 3.30% | 3.30% | $1,300 | 0.00% | 0.00% |
| 91 | 1 | Augusta, GA | $920 | 2.20% | -7.10% | $1,070 | 5.90% | -2.70% |
| 92 | -2 | Memphis, TN | $900 | -1.10% | 0.00% | $1,000 | 0.00% | 0.00% |
| 92 | 2 | Tulsa, OK | $900 | 1.10% | -1.10% | $1,000 | -3.80% | -9.10% |
| 92 | 2 | Winston Salem, NC | $900 | 1.10% | -12.60% | $1,110 | 0.90% | -3.50% |
| 95 | 2 | Lincoln, NE | $890 | 6.00% | 9.90% | $1,120 | 5.70% | 8.70% |
| 95 | -3 | El Paso, TX | $890 | -1.10% | 7.20% | $1,170 | 4.50% | 6.40% |
| 97 | -1 | Oklahoma City, OK | $880 | 2.30% | 2.30% | $1,070 | 1.90% | -0.90% |
| 98 | 0 | Shreveport, LA | $800 | 3.90% | 9.60% | $860 | 1.20% | 3.60% |
| 99 | 0 | Akron, OH | $760 | 0.00% | 8.60% | $900 | 0.00% | 5.90% |
| 100 | 0 | Wichita, KS | $700 | 1.40% | 0.00% | $900 | 2.30% | 2.30% |
About
The rental data for Zumper’s National Rent Report analyzes over one million active listings across the country every month. Listings are aggregated to calculate median asking rents for the top 100 most populous cities and therefore provides a comprehensive view of the current state of the market. Any data that is reported does not include short term listings. View our full methodology here.
To keep up to date with rent changes across the country, like or follow Zumper on Facebook and Twitter. In the market for a new place? Search apartments for rent on Zumper.
Related content

